GOES in Earth Engine
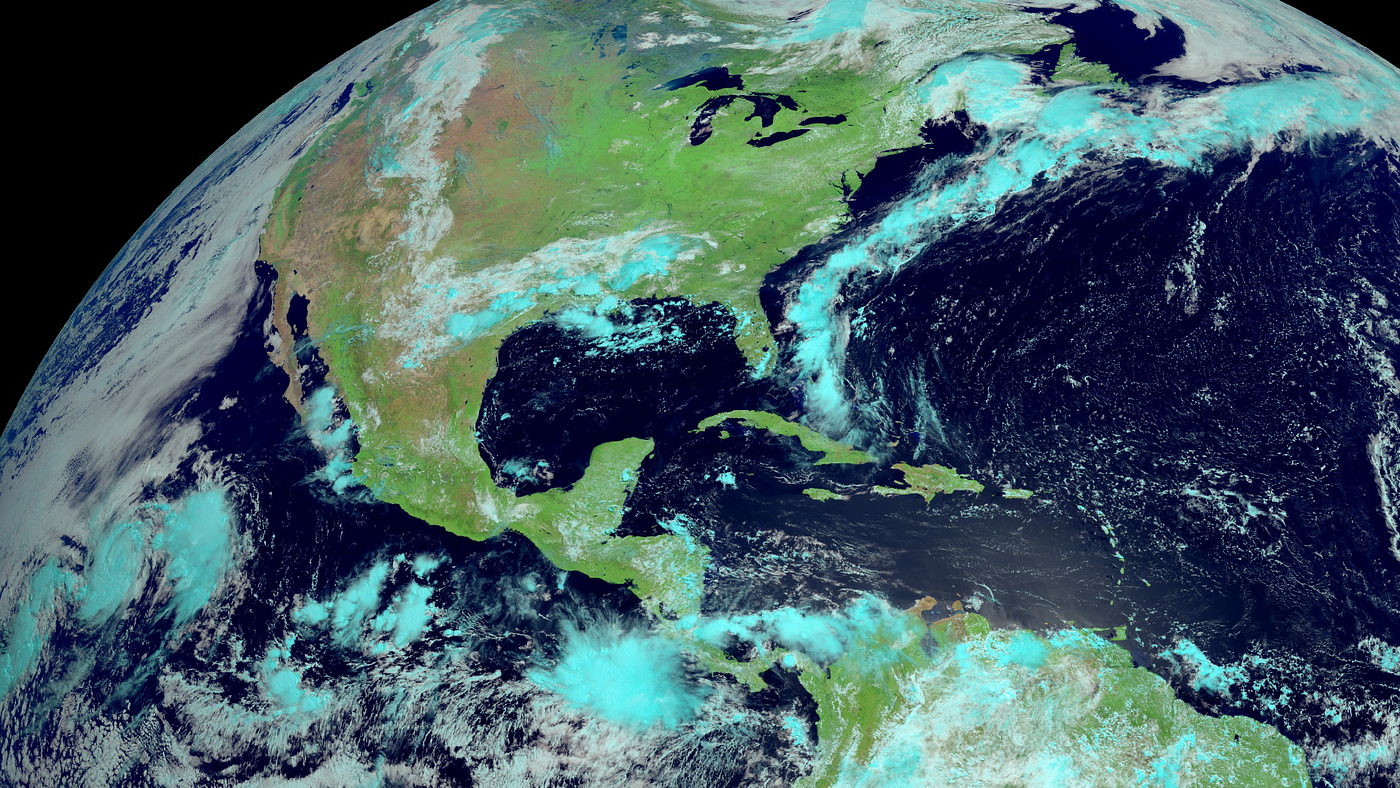
Within the Earth Engine Data Catalog, you’ll find a series of entries originating from the Geostationary Operational Environmental Satellites (GOES). GOES is a program administered by NOAA and NASA to provide advanced imagery and atmospheric measurements of Earth’s weather, oceans, and environment. This post describes the GOES datasets available in Earth Engine and provides sample scripts for working with the data.
Two satellites
There are two geostationary satellites in the GOES-R series that maintain their respective views of Earth continuously.
- GOES-16 (East): positioned at 75.2° W
- GOES-17 (West): positioned at 137.2° W

Two data products
Earth Engine archives the Cloud and Moisture Imagery (CMI) and Fire/Hotspot Characterization (FHS) data products. They are derived from measurements collected by the Advanced Baseline Imager (ABI) instrument.
- CMI: includes 16 bands from selected visible, near-infrared, and infrared spectral regions.
- FHS: includes estimates of wildland fire area, temperature, and power.
Three scan types
GOES ABI data are available in three different types that define the spatial extent and observation rate: Full Disk, CONUS, and Mesoscale.
- Full Disk: full field of view from GOES 16 and 17, one image every 10 minutes per satellite.

- CONUS: subsets of the full disk focused on the contiguous United States and eastern Pacific Ocean, one image every 5 minutes per satellite.

- Mesoscale: two relatively small regions per satellite are actively tasked to image a requested region (or a default region), one image per domain every minute. The following image demonstrates the highly dynamic scan regions of the Mesoscale dataset. Note that the Mesoscale scan type is not available for the Fire/Hotspot Characterization product.

Use the scan type that best suits your need, for example, if you are interested in annual weather patterns in northern British Columbia, you’ll need to use the Full Disk dataset because CONUS will have no coverage, and Mesoscale will have only sporadic coverage, if any. Additionally, you’ll likely want to use data from GOES-17 so that observations are closer to nadir (less oblique). On the other hand, if you are interested in a particular weather event where a high observation rate is important (like a hurricane), check the Mesoscale dataset for coverage.
Near real-time monitoring
GOES ABI data are generally available for access in Earth Engine within an hour of observation. The following are average latency for August and September, 2021 for each scan type.
- Full Disk: 40–50 minute latency
- CONUS: 15–25 minute latency
- Mesoscale: 10–20 minute latency
Low latency means you can monitor developing crises from severe weather to wildfires in near real-time. Google is actually using Earth Engine and the GOES Fire/Hotspot Characterization data operationally to develop near real-time fire boundary layers that are displayed in alerts on Google Search and Google Maps.
Earth Engine Data Catalog IDs
The following are lists of GOES Earth Engine image collection import snippets.
// GOES-16
ee.ImageCollection('NOAA/GOES/16/MCMIPF')  // Full Disk
ee.ImageCollection('NOAA/GOES/16/MCMIPC')  // CONUS
ee.ImageCollection('NOAA/GOES/16/MCMIPM')  // Mesoscale// GOES-17
ee.ImageCollection('NOAA/GOES/17/MCMIPF')  // Full Disk
ee.ImageCollection('NOAA/GOES/17/MCMIPC')  // CONUS
ee.ImageCollection('NOAA/GOES/17/MCMIPM')  // Mesoscale
// GOES-16
ee.ImageCollection('NOAA/GOES/16/FDCF')  // Full Disk
ee.ImageCollection('NOAA/GOES/16/FDCC')  // CONUS// GOES-17
ee.ImageCollection('NOAA/GOES/17/FDCF')  // Full Disk
ee.ImageCollection('NOAA/GOES/17/FDCC')  // CONUS
GOES time series animation
Earth Engine image collections can be styled and visualized as animated GIFs and MP4s. The following code shows three different perspectives of the Creek Fire (California) on September 5th, 2020.
- True-color time series
- False-color time series
- Fire-detected pixels overlaid on the true-color time series
The first step is to prepare the CMI data for visualization. Here, we define functions for applying scaling and offset factors, adding a synthetic green band (learn more), and scaling for visualization (learn more).
Next, the image collection is built, display parameters are defined, and the collection is rendered to the Earth Engine Code Editor console in a ui.Thumbnail widget as a GIF animation. Note that the selected bands are ordered as red, green, and blue to achieve a true-color appearance.
The true-color representation is great for visualizing the extent of the smoke, but if you want to see the fire-affected pixels, you can set the RGB red coordinate as the 1.58–1.64µm NIR band, the green coordinate as the red band, and the blue coordinate as the synthetic green band.
Thin layers of smoke are more transparent in this representation, but the fire is visible. For a slightly more quantitative display of fire-affected pixels, the FHS data can be overlaid on either the true-color or the false-color composites. To accomplish this, the fire detection data are joined to the CMI data, based on observation time. For each pair of images identified, the FHS image is overlaid on the CMI image using the .blend() function. The FHS data contains several bands including area, temperature, power, and mask category. Here, all medium to high confidence fire-detected pixel categories are considered fire and set as a semi-transparent red color.
When zoomed into the region, you can see individual pixels that are affected by fire. These data are useful for mapping the boundary of fires and monitoring fire progression in near real-time.
Conditions on Earth are changing by the second. GOES ABI provides an important dataset for observing Earth in near real-time. I hope this post gives you a better sense for the GOES ABI data available in Earth Engine and how to start exploring it.
